
Use the Executive Dashboard
Management indicators trends module measures and supporting breakdowns
Open Overview > Executive Dashboard for a management view of profitability, liquidity, trends and operating modules. Start with the selected company and dates, then follow a linked value to the supporting breakdown. A dashboard card is an investigation starting point, not a payment instruction, tax return, approval or independent financial statement.
This guide is for authorised managers and accountants. The Executive Dashboard gives broad company-level visibility, including payroll and supplier/customer information. A Tenant Administrator should assign Management / Executive Dashboard access only to appropriate users. Existing journal-view access also permits this dashboard in this release. Access to a source transaction can require its own permission; do not broaden a user's access merely to make a link open.
Prepare the financial and operational sources
Confirm the selected company, functional currency, account classifications and completed GL postings. Review customer/vendor documents, applications, current stock values, payroll, production, assets and POS in their source modules. A saved operational document and a posted GL result are not interchangeable.
The screen has no location selector. It is not a multi-company consolidation, and changing a module filter does not restrict the other company-wide KPI panels. If an executive should see only a location or limited business area, agree an appropriate reporting/access solution with the Tenant Administrator.
Apply the dates and display unit
- Confirm Current Company and open Overview > Executive Dashboard.
- Enter From and To, then choose Apply. Review the resulting period after loading completes. The initial dates are normally calendar year to date, not automatically the company's financial year.
- Choose Display Unit: Actual, Thousands, Millions or Billions. The initial display is Thousands. For an exact comparison with a breakdown or source report, switch to Actual and use the underlying amount rather than a rounded chart label.
- Review the four headline cards, trend, top parties, Balance Mix, module cards and Largest GL Balances. Read the basis for each metric below before comparing it with a period report.
- Open a linked amount or trend point to investigate. Check the breakdown's period, units, status and supporting rows before returning to the dashboard.
Applying filters and changing Display Unit do not save transactions, post journals or alter accounting amounts. Changing a date input alone does not reload the figures; choose Apply. After any loading error, do not assume old cards have refreshed to the newly typed dates.
Recognise the Executive Dashboard screen
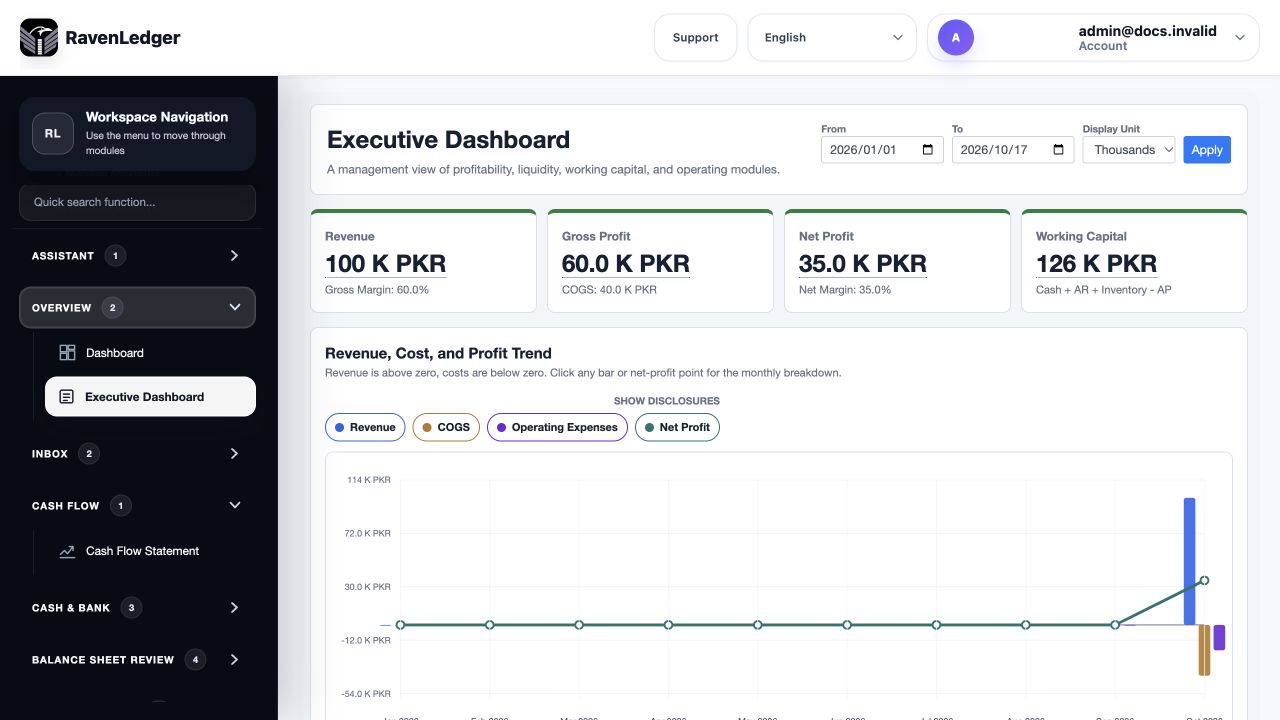
Understand every control
| Control | Purpose | What it does not do |
|---|---|---|
| From and To | Select the period used by period-based metrics | Does not make every current master balance a historical snapshot. |
| Apply | Reloads data for the entered dates | Does not approve, post or correct source documents. |
| Display Unit | Scales monetary headline/chart/card values for reading | Does not change currencies, percentages, record counts or stored precision. |
| Show disclosures: Revenue, COGS, Operating Expenses, Net Profit | Show or hide the corresponding trend series | Does not remove transactions from totals; at least one series remains visible. |
| All Modules selector | Shows all module cards or one selected module and its Detail panel | Does not filter the headline cards, trend, top parties or Balance Mix to that module. |
| Linked headline or module value | Opens the configured supporting breakdown or source list | A count link may open a list rather than an amount reconciliation. |
| Linked bar or net-profit point | Opens the selected month's supporting financial breakdown | Compare that month's clipped period, not the entire dashboard range. |
| Linked customer/vendor bar | Opens that party's contributing period documents | Ranking is by net document amount, not necessarily overdue exposure or cash collected. |
| Linked Largest GL Balances amount | Opens GL transactions for the account through the cutoff | It is not the complete trial balance; only the largest balances are listed. |
| Back to Executive Dashboard | Returns from a breakdown | Recheck the period and Display Unit; filters may return to their initial values. |
The page does not have a dedicated Excel-export, chart-type or Save control. Use Reporting Center, the financial Dashboard export or the relevant source report when a controlled workbook is required.
Read the headline indicators
| Indicator | Calculation or source | Interpretation |
|---|---|---|
| Revenue | Posted GL income for the period | Not simply customer invoice gross or cash received. Income account design determines what is included. |
| Gross Profit | Revenue minus identified COGS | Review the recognised account/group classifications; it is not Revenue minus all expenses. |
| Gross Margin | Gross Profit / Revenue x 100 | The display is 0 when Revenue is 0; this does not establish a meaningful zero-revenue margin. |
| Net Profit | Posted period income minus all period expenses | Includes the applicable non-operating expense portion even when that portion is not a separate trend bar. |
| Net Margin | Net Profit / Revenue x 100 | Review negative/zero revenue and unusual credits before using it as a performance percentage. |
| Working Capital | Closing Cash + Open AR + current Inventory Stock Value - Open AP | A management indicator using the specific source bases below, not a full statutory current-assets-minus-current-liabilities calculation. |
For example, fictional revenue of PKR100,000 less COGS of PKR40,000 gives Gross Profit of PKR60,000 and Gross Margin of 60%. If all expenses total PKR65,000, Net Profit is PKR35,000 and Net Margin is 35%. Do not subtract COGS again from an already calculated Net Profit.
Changing Display Unit to Thousands shows PKR100,000 as approximately 100K PKR. Counts and margins are not divided by 1,000. Rounded labels may not add exactly; compare unscaled values and full supporting totals.
Distinguish period figures from current balances
| Area | Basis used in this release | Consequence for comparison |
|---|---|---|
| Revenue, costs, profit and monthly trend | Posted GL movement between From and To, by Ledger Date | Compare a posted period P&L, not all saved invoices. |
| Assets, liabilities and equity | Financial Dashboard's closing values at To | Compare the same-cutoff Balance Sheet and its display signs. |
| Open AR and Open AP | Current unpaid values of visible documents whose Ledger Dates fall within From/To | Earlier open documents are omitted, and later applications can change current unpaid values. These are not historical aging-as-of totals. |
| Top Customers and Top Vendors | Net receivable/payable document amounts for visible documents in the period | Notes and other visible document types can affect counts and amounts; this is not an invoice-only or collection-only ranking. |
| Inventory Stock Value and stock quantity | Current company inventory-cost records | Changing To to a prior month does not recreate historical stock valuation. Quantities can combine different item units and should not be treated as one product's quantity. |
| Asset gross cost and NBV | Current asset master values | Not a historical asset register at To; event counts have their separate dates. |
| Active employees, active items, active bank accounts, open POS sessions, open trade references | Current source status | Not the counts that necessarily existed at a past To Date. |
| Production batch cost and quantities | Batches with Ledger Dates in the period | Batch status counts are current across the company; planned/completed quantities can include different products and units. |
| Purchasing commitments | Full functional net payable on POs dated in the period | Not limited to approved or remaining uninvoiced quantities. Review approval and fulfilment separately. |
| Payroll amounts | Lines of payroll runs whose Pay Dates are in the period | Can include draft runs; the separate Posted Runs count does not filter all displayed pay amounts to posted-only. |
| POS sales | Checked-out tickets created in the period; sale totals less return totals | This uses ticket creation dates and source ticket totals, not the GL ledger-date revenue basis. |
| Trade Expected Amount | Current sum of reference Expected Amounts, including open and closed references | Source reference currencies are not converted by this sum. Do not treat a mixed-currency total as functional exposure. |
Working Capital therefore combines a closing cash cutoff with period-selected current AR/AP and current stock. For a historical financial close, use the appropriate full-population aging, stock valuation, bank and GL reports instead. In a company with an older unpaid invoice, narrowing From Date can remove that invoice from Open AR even though the customer still owes it.
Review the trend and party charts
Revenue, Cost, and Profit Trend shows monthly values. Revenue bars are normally above zero; COGS and Operating Expenses are drawn below zero for visual comparison. Net Profit is a separate series. The first and last months use only dates inside the selected range, so a half-month result should not be compared with a full month without adjustment.
Use Show disclosures to simplify the chart; it changes visibility only. Non-operating expenses still affect Net Profit even though they are not a separate displayed cost series. Click a bar or net-profit point to inspect that month's breakdown.
Top Customers and Top Vendors show up to five parties, ranked by their period net document amounts. A high sales bar does not mean high cash collections, and a reducing note can affect the net ranking. Click the party amount and compare the source document types, dates and functional amounts.
Balance Mix displays Assets, Liabilities and Equity at the closing cutoff. Bar lengths compare magnitudes against the largest displayed value; they are not percentages of a 100% whole. Read signed amounts and confirm Assets = Liabilities + Equity separately.
Understand all twelve module cards
| Module card | Primary and secondary values | Follow-up and caution |
|---|---|---|
| General Ledger | Net Profit; Gross Margin | Opens financial breakdowns. Reconcile to posted P&L and the approved COGS split. |
| Cash & Bank | Closing Cash; Active Bank Accounts | Closing cash uses Cash & Cash Equivalents classification, not simply every bank record. Bank count is current. |
| Accounts Receivable | Open AR; Invoices | Uses the selected period's visible document population and current unpaid values; the count is not necessarily only ordinary invoices. |
| Accounts Payable | Open AP; Bills | Same population/current-unpaid distinction on supplier documents; not full historical aging. |
| Purchasing | Commitment; Pending Approval | Commitment uses whole period PO values. Pending Approval counts Submitted POs; it is not an approval action. |
| Inventory | Stock Value; Active Items | Current stock valuation and active inventory-item count; reconcile quantities by item/UOM. |
| Production | Batch Cost; In Process | Cost is for period-dated batches; In Process is a current status count. Neither proves completed output was posted. |
| Human Resources | Net Pay; Active Employees | Pay-date period line totals can include draft runs; active employees is current. Treat payroll data as confidential. |
| Fixed Assets | Net Book Value; Active Assets | Current master values and active count; use asset reports for cutoff accounting. |
| Tax | Payroll Tax; Active Tax Codes | Payroll-tax detail and current setup count, not a complete tax return, FBR submission or tax-payable control. |
| Point of Sale | Net POS Sales; Open Sessions | Checked-out ticket totals less returns for the creation-date period, plus current open sessions. Check ticket currency and fiscal status separately. |
| Trading | Expected Amount; Open References | Current reference amounts/status; different registered currencies cannot be added as one functional amount. |
Healthy, Watch and On Track are simple display signals, not audit opinions or configurable risk limits. For example, a nonzero open balance or an open session can trigger Watch without being overdue or erroneous. Inspect the source before acting.
Read the selected module Detail panel
The selector adds a Detail panel for the selected module. Use the following meanings; the initial label formatting and numeric precision are not a substitute for the source unit or status.
| Detail area | Fields and interpretation |
|---|---|
| Accounts Receivable | Invoices is the count of visible period documents; Sales sums their functional net receivable; Collections sums their recorded functional paid amounts; Open Balance sums current functional unpaid amounts. Collections is not a separate receipt-date cash-flow report. |
| Accounts Payable | Bills, Purchases, Paid and Open Balance use visible period vendor documents and their current functional net/paid/unpaid amounts. They do not isolate cash paid during that date range. |
| Inventory | Active Items counts active inventory items; Stock Qty and Stock Value are current cost-record totals; Transactions In Period counts inventory transactions by transaction date. Mixed item quantities have different units. |
| Fixed Assets | Active Assets, Disposed Assets, Gross Cost and Net Book Value are current master measures. Adjustments In Period uses event Ledger Date; Disposals In Period uses Disposal Date. |
| Cash & Bank | Opening Cash, Net Cashflow, Closing Cash Equivalents, Operating Cashflow, Investing Cashflow and Financing Cashflow use the statement's cash bridge. Check the full Cash Flow Statement for Expected Closing Cash and Reconciliation Difference, which are not headline cards here. |
| Production | In Process Batches and Completed Batches are current statuses; Planned Qty Period, Completed Qty Period and Total Batch Cost Period use period batch Ledger Dates. |
| Purchasing | Purchase Orders counts period POs; Pending Approval counts Submitted, Approved Orders counts Approved, Open Orders counts Open; Commitment Value sums whole functional PO net amounts rather than remaining quantities. |
| Point of Sale | Tickets, Sales Tickets and Return Tickets count checked-out period-created tickets; Open Sessions is current; Net Sales subtracts returns; Tax Collected sums stored ticket tax. Confirm return tax signs and fiscal treatment in POS reports. |
| Human Resources | Active Employees is current; Payroll Runs, Draft Runs and Posted Runs use period Pay Dates; Posted Runs includes Posted/Paid statuses. Gross Pay, Payroll Tax and Net Pay are line totals, not proof of payroll posting or payment execution. |
| Tax | Active Tax Codes, Tax Code Lines and Payroll Tax Codes are active setup counts. Payroll Tax Period sums TAX details by payroll Pay Date; POS Tax Period comes from POS ticket tax. This is not all customer/vendor sales tax or withholding. |
| Trading | Open References, Closed References, Export References and Import References are current counts; Expected Amount sums stored amounts across the references, without a currency conversion or period restriction. |
Selecting Cash & Bank shows the cash-flow Detail measures; bank counts remain on the card. For General Ledger, use the headline links and financial statements if no additional Detail figures are shown.
Whole-number Detail amounts can display as plain numbers without the monetary scale/suffix used on headline cards. Do not interpret an unlabelled Detail number as Thousands simply because Display Unit is Thousands. Check Actual and the supporting breakdown before copying values into a management pack.
Reconcile a supporting breakdown
The Executive Dashboard Breakdown shows From, To, Rows, an Amount label, functional currency, Reconciliation Basis and a total. The rows contain Date, Type, Number, Party / Source, Description, Status and the selected Amount. Rows is the full result count; pagination changes which rows are visible, not the total.
For a normal monetary metric, compare the unscaled dashboard value with the complete breakdown total using the same basis. Gross Profit and Net Profit breakdowns include negative costs/expenses; a negative cost contribution is intentional. A linked Number can open a more detailed account or document view, subject to access.
Do not compare that total with only one page's rows, or compare a current stock/asset amount with a historical ledger cutoff. For trade references, reconcile by registered currency before using exposure totals. Review the next-level GL drill-down's period versus closing-balance distinction in the financial Dashboard guide.
Largest GL Balances lists up to twelve accounts ranked by absolute closing magnitude. It uses available balance snapshots and normal-nature display signs; it is not a balanced trial balance and cannot demonstrate that every account was included. Use the full trial balance for close and reconciliation.
Resolve common questions safely
| Question or symptom | Check and next action |
|---|---|
| Open AR/AP differs from the aging report | Compare document-date population, earlier open items, current versus historical unpaid amounts, source types and functional currency. |
| Profit does not match POS sales or customer invoice totals | GL Revenue, ticket gross/net, tax, dates, notes, unposted records and income mappings use different bases. Reconcile sources rather than forcing equality. |
| Historical stock/NBV or staff count looks unchanged | Those metrics are current master/cost balances; use the appropriate historical report. |
| A rounded card differs from supporting total | Select Actual, check full precision and include all pages/negative contributions. |
| A module shows zero despite known activity | Check period basis and the source module. Zero is not proof of no activity if data could not be loaded. |
| Loading fails or cards look stale | Keep the error and intended parameters, refresh/apply after resolving access or processing, and verify that the result actually updates. Do not save replacement source documents. |
| A source link is unavailable | Ask the Tenant Administrator to review the intended least-privilege access; dashboard access does not authorise changes. |
| A trading amount appears in the company currency | Check each reference currency; the displayed sum is not an automatic currency conversion. |
Correct genuine errors in the originating module through its permitted workflow, confirm posting where needed and then reload. Editing a downloaded spreadsheet or changing a display unit cannot correct the application.
Continue with the related task
Financial Dashboard, Cash Flow Statement, Reporting Center, report parameters, customer notes and invoices, vendor notes and invoices, stock reconciliation, payroll, assets, POS and trade references.