
Review the financial Dashboard
Balance Sheet and period Profit and Loss with account drill downs
Use Overview > Dashboard to review the selected company's Balance Sheet and Profit & Loss together. The Balance Sheet answers what the company holds and owes at the To Date. Profit & Loss answers what income and expenses were recorded during the selected period. Neither panel is a bank reconciliation or a list of unpaid invoices.
This guide is for authorised accountants and managers. Dashboard access can expose company-wide financial information: there is no location selector on this screen. Ask the Tenant Administrator for the appropriate dashboard access rather than assuming permission to one transaction grants permission to all company totals.
Choose the right dashboard
| Screen | Use it for | Important boundary |
|---|---|---|
| Overview > Dashboard | Account-level Balance Sheet and period Profit & Loss | Balance Sheet is as of To Date; P&L uses From Date through To Date. |
| Cash Flow > Cash Flow Statement | Operating, investing and financing movement and the cash bridge | The screen is labelled Cash Flow Statement, not Cash Flow Dashboard. Review classification and reconciliation before relying on the result. |
| Overview > Executive Dashboard | Revenue, margins, management indicators, trends and module summaries | Some values are current balances and others are period activity; see the detailed metric guide. |
| Reporting Center | Detailed standard or approved user reports | Match each report's parameters, status and currency before comparison. |
Read the Cash Flow Statement guide, Executive Dashboard guide and Reporting Center guide for their separate controls.
Prepare accounts and posting first
Confirm Current Company, functional currency, reporting account types, groups and posting sub-accounts. Asset, Liability, Equity, Income and Expense classifications determine the financial sections. Check the intended COGS and non-operating expense classifications with the accounting owner; those splits also depend on recognised account/group descriptions. Renaming an account can affect a management classification, so do not rename accounts merely to move a number on the dashboard.
Complete authorised journal approval and posting before expecting a financial result. An entry that is saved, queued, failed or awaiting approval is not a posted journal. Check linked journals for subledger transactions and use journal posting controls if processing is incomplete. Keep the system-maintained retained-earnings account intact.
Set the period and generate the view
- Confirm Current Company, then open Overview > Dashboard.
- Enter From Date and To Date. Use a valid chronological range and check the displayed dates after the refresh; the initial view normally starts on 1 January of the current calendar year, not the company's financial-year start.
- Choose Reporting Account for combined parent-account rows, or Chart of Account for individual posting-account rows. A level button submits the form, so review the refreshed period as well as the selected level.
- Choose Update after changing the dates. Read the displayed functional currency and section headings before comparing numbers.
- Review totals, expand the investigation through linked amounts, then export the generated view where needed. Changing a report filter does not post, approve or correct a transaction.
Recognise the financial Dashboard screen
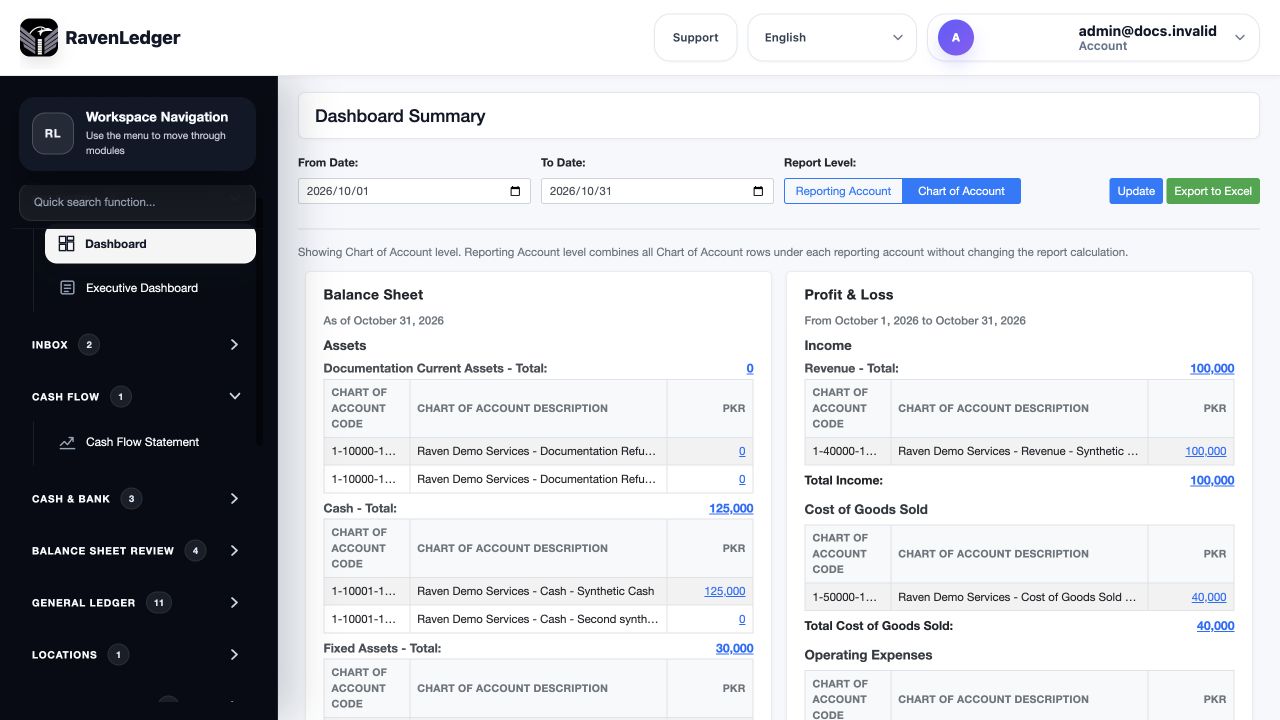
Understand every filter and action
| Field or control | Purpose and default | Effect and check |
|---|---|---|
| Current Company | Company selected in the application header | All totals relate to this company; this is not a multi-company consolidation. |
| From Date | Start of the P&L movement period; initial calendar-year start | It does not remove earlier Balance Sheet balances from the closing position. |
| To Date | End of P&L period and Balance Sheet cutoff | Posted ledger dates through this day are relevant, including earlier Balance Sheet activity. |
| Report Level: Reporting Account | Combines posting accounts under their parent reporting account | Changes the row grouping, not the total or accounting classification. |
| Report Level: Chart of Account | Shows individual posting accounts; initial detail level | Use this level to isolate a particular posting account. |
| Update | Refreshes using the entered period and current level | Check the resulting headings, not only the dates still typed in the form. |
| Export to Excel | Downloads the generated summary with its period, currency and level | Update first; an export link reflects the last generated parameters, not unsent date edits. Protect the downloaded company data. |
| Linked amount | Opens transactions for that section, group or account | A period transaction drill-down is not automatically the full closing balance. |
| Journal number | Opens the linked journal in its permitted view | Reviewing a journal does not approve it or authorise editing. |
| Export Excel on the drill-down | Downloads the selected supporting transaction detail | Check filters and the complete total, not only the rows on the current page. |
| Back to Dashboard | Returns to the summary route with the period | Recheck Report Level; returning may restore the default detail level. |
There is no dashboard Save button, transaction currency selector or location filter. The amounts are functional-currency values; they are not sums of unconverted invoice currencies.
Read the Balance Sheet and Profit and Loss
| Display | Meaning | Reconciliation rule |
|---|---|---|
| Assets | Closing asset balances at To Date | Normal debit balances display positive; a credit asset balance can display negative. |
| Liabilities and Equity | Closing balances at To Date | Credit-nature balances are displayed positive, reversing the GL debit-minus-credit convention. |
| System retained earnings | Cumulative posted P&L contribution through To Date | Do not substitute the profit for only the selected From/To period or manually edit the system account. |
| Income | Period income movement | Net credits display as positive income. This is not cash collected. |
| Cost of Goods Sold | The identified cost-of-sales portion of expenses | It is part of Total Expenses, not an additional deduction from an already net profit. |
| Operating Expenses | Expenses not identified as COGS or non-operating | Review account descriptions and groups when the split is unexpected. |
| Non-Operating Expenses | The separately identified expense portion | It still contributes to Total Expenses and period profit. |
| Total Expenses | All expense movement for the period | Reconcile COGS plus operating plus non-operating expenses to this figure. |
| Profit / (Loss) | Income less Total Expenses | Positive is profit; negative is loss. It is not cash flow or a distributable-profit approval. |
| Group total | Sum of accounts in that displayed group | Reporting Account versus Chart of Account should preserve the section total. |
Compare Assets with Liabilities plus Equity at the same cutoff. If the equation or a source control does not reconcile, inspect classification, postings and the actual supporting reports before using the figures in a close pack.
Investigate a number without confusing balance and movement
Click an account, group or total amount to open Dashboard Drill-down. Its filters identify Section, Group, Account, From and To where applicable. The table shows Ledger Date, Transaction Date, Journal #, Line #, Transactional Currency, Account, Description, Functional Debit and Functional Credit. Ledger Date is the accounting cutoff; Transactional Currency identifies the source currency, but the debit/credit columns remain functional amounts.
The top Debit, Credit and Net (Dr-Cr) totals cover the filtered result, not just a page of rows. Use the pagination controls for more rows. Income, liability and equity display signs can be the opposite of Net (Dr-Cr).
For a Balance Sheet link, the drill-down shows transactions within the selected period, whereas the summary includes earlier balances. In the training example, opening cash PKR100,000 plus October movement PKR25,000 gives closing cash PKR125,000. An October-only transaction total of PKR25,000 is not a missing PKR100,000 posting. Compare opening balance plus movement with closing balance using the matching trial balance or transaction report.
When a system retained-earnings account opens a source breakdown, inspect the contributing income/expense records and displayed dates. A selected-period source list need not equal the cumulative retained-earnings summary. Do not post a plug journal to force them to match.
Work through a period example
Assume fictional PKR income of 100,000, COGS of 40,000, operating expenses of 20,000 and non-operating expenses of 5,000, all posted in October. Total Expenses is 65,000 and Profit is 35,000. Do not deduct COGS of 40,000 again from the 35,000 profit.
If the company also has profit from earlier periods, the system retained-earnings presentation can exceed October's 35,000. Changing From Date to 1 October changes P&L movement but not the same 31 October Balance Sheet closing position. These figures illustrate the relationships, not prescribed account balances or tax treatment.
Reconcile export and financial reports
Compare the dashboard with the trial balance and appropriate income/expense detail at the same company, ledger cutoff, posted state and functional currency. Use the same grouping when comparing rows; parent-account rows are not additional posting accounts. Compare full-precision or exported amounts where display rounding creates a small apparent difference.
For receivables, payables, stock, assets and banks, also reconcile the corresponding subledger. A balanced Balance Sheet does not prove that every customer balance, inventory quantity or bank statement is correct. Use report parameters, Balance Sheet Review and bank reconciliation.
Resolve common dashboard questions
| Symptom | Check and safe action |
|---|---|
| A saved invoice or journal is absent | Check its actual posted journal, company and ledger date; do not save a duplicate. |
| The closing balance differs from drill-down Net | Include the opening balance and the section's display sign. |
| P&L changes when From Date changes | This is period movement; compare the intended dates and leave closing Balance Sheet logic separate. |
| COGS is included in Operating Expenses | Review the approved group/account descriptions and classification; do not change history to improve a chart. |
| Excel uses the previous period | Update the view first, then export and check the workbook heading. |
| Dashboard or journal link is unavailable | Ask the Tenant Administrator to review the appropriate access; a visible total is not permission to alter its source. |
| The financial statement remains inconsistent | Retain parameters and source journal identities and ask the accounting owner/support to investigate before closing. |
Continue with the related task
Cash Flow Statement, Executive Dashboard, account setup, GL posting and close, Reporting Center and report parameters.
Data-loading prerequisites and limits for Reporting Center and dashboards
Report export downloads a filtered snapshot; it is not an upload-ready update file and does not write changes back to the ledger. Use the relevant module's actual import template for business records, or the review schedule's own import for support.
Continue with the Balance Sheet Review and close bulk guidance.